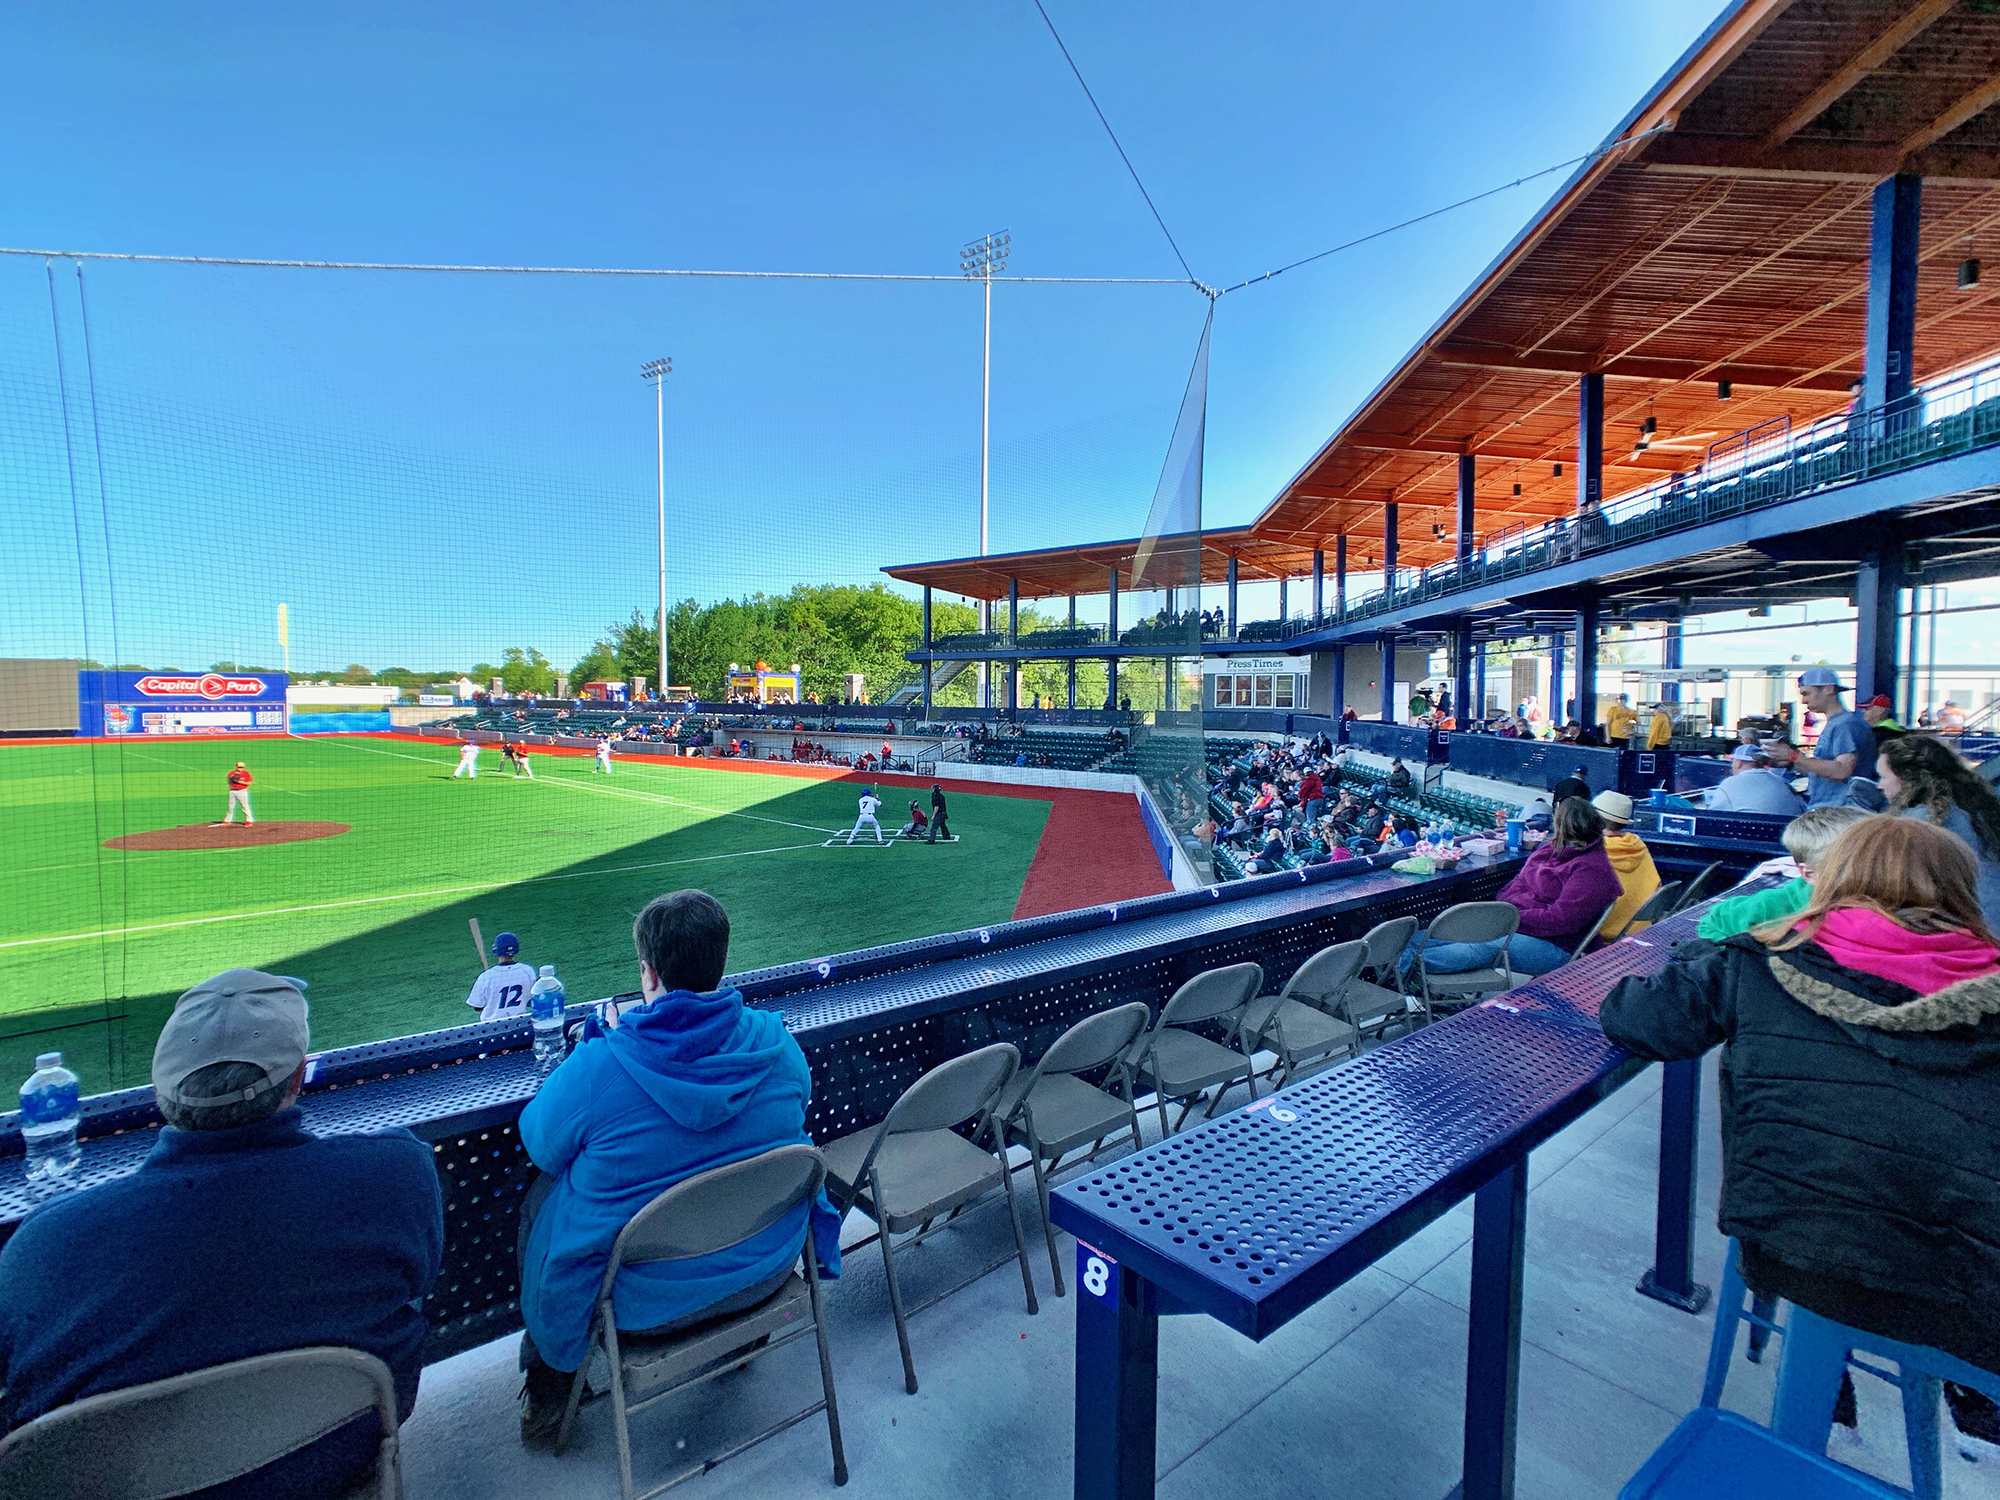
Yes, it’s that time of year again. With the 2019 summer-collegiate regular season ending yesterday, it’s time to review this season’s attendance totals. We begin with a listing of 2019 summer collegiate attendance by league .
Within each league teams are ranked by average attendance.
We’ll also be covering 2019 summer collegiate attendance by totals and per-game average today. This posting covers the summer-collegiate leagues where every team reports attendance and charges admission. There are other summer collegiate leagues listing partial attendance, and we’ll save those team numbers for the total and per-game averages.
Cal Ripken Collegiate Baseball League
# Team TOTAL GMS AV 2018 Change
1
Bethesda Big Train
8,225
19
433
488
-0.11
2
SS-T T-Bolts
3,005
16
188
217
-0.13
3
Gaithersburg Giants
1,700
17
100
4
24.00
4
Alexandria Aces
1,137
17
67
84
-0.20
5
D.C. Grays
952
16
60
123
-0.51
6
FCA Braves
670
15
45
NA
NA
TOTALS 15,689 100 157 107 0.47
Cape Cod League
# Team TOTAL GMS AV 2018 Change
1
Chatham Anglers
35,496
21
1,690
1,840
-0.08
2
Orleans Firebirds
31,432
21
1,497
1,243
0.20
3
Y-D Red Sox
27,926
21
1,330
1,083
0.23
4
Hyannis Harbor Hawks
23,546
19
1,239
1,588
-0.22
5
Cotuit Kettleers
25,150
21
1,198
1,335
-0.10
6
Harwich Mariners
20,845
19
1,097
1,190
-0.08
7
Falmouth Commodores
17,450
18
969
1,047
-0.07
8
Brewster Whitecaps
19,233
20
962
1,025
-0.06
9
Bourne Braves
18,681
20
934
1,064
-0.12
10
Wareham Gatemen
16,555
20
828
931
-0.11
TOTALS 236,314 200 1,182 1,235 -0.04
Coastal Plain League
# Team TOTAL GMS AV 2018 Change
1
Savannah Bananas
117,729
28
4,205
4,229
-0.01
2
Macon Bacon
56,258
24
2,344
2,244
0.04
3
Gastonia Grizzlies
38,331
23
1,667
2,035
-0.18
4
Lexington County Blowfish
36,911
24
1,538
1,627
-0.05
5
Wilson Tobs
31,796
23
1,382
1,522
-0.09
6
Wilmington Sharks
29,848
24
1,244
1,183
0.05
7
Holly Springs Salamanders
28,043
26
1,079
970
0.11
8
Peninsula Pilots
26,950
25
1,078
2,083
-0.48
9
HP-Thomasville HiToms
20,866
20
1,043
1,138
-0.08
10
Fayetteville Swampdogs
22,212
24
926
1,502
-0.38
11
Morehead City Marlins
21,104
24
879
1,312
-0.33
12
Florence Redwolves
17,048
21
812
826
-0.02
13
Martinsville Mustangs
14,056
18
781
570
0.37
14
Asheboro Copperheads
17,790
23
774
788
-0.02
15
Edenton Steamers
13,913
23
605
596
0.02
16
Forest City Owls
8,183
21
390
502
-0.22
TOTALS 501,038 371 1,351 1,475 -0.08
Expedition League
# Team TOTAL GMS AV 2018 Change
1
W. Nebraska Pioneers
31,440
27
1,164
936
0.24
2
Badlands Big Sticks
24,516
33
743
615
0.21
3
Casper Horseheads
20,687
28
739
780
-0.05
4
Pierre Trappers
20,313
29
700
525
0.33
5
Souris Vall. Sabre Dogs
20,890
32
653
721
-0.09
6
Hub City Hotshots
15,219
26
585
545
0.07
7
Hastings Sodbusters
17,171
30
572
641
-0.11
8
Spearfish Sasquatch
10,632
28
380
341
0.11
9
Wheat City Whiskey Jacks
10,581
29
365
NA
NA
10
Freemont Moo
7,443
31
240
NA
NA
TOTALS 178,892 293 611 642 -0.05
Futures Collegiate Baseball League
# Team TOTAL GMS AV 2018 Change
1
Worcester Bravehearts
72,069
28
2,574
2,502
0.03
2
Brockton Rox
36,682
28
1,310
1,393
-0.06
3
North Shore Navigators
32,997
27
1,222
1,237
-0.01
4
Nashua Silver Knights
31,203
27
1,156
1,525
-0.24
5
Pittsfield Suns
32,059
28
1,145
1,519
-0.25
6
Bristol Blues
25,463
26
979
1,261
-0.22
7
Westfield Starfires
23,824
27
882
NA
NA
TOTALS 254,297 191 1,331 1,514 -0.12
Florida Collegiate Summer League
# Team TOTAL GMS AV 2018 Change
1
Leesburg Lightning
10,028
18
557
671
-0.17
2
DeLand Suns
4,556
18
253
275
-0.08
3
Seminole Co. Scorpions
4,641
19
244
123
0.98
4
Sanford River Rats
4,348
18
242
100
1.42
5
Winter Park Diamond Dawgs
3,473
17
204
75
1.72
6
Winter Garden Squeeze
3,609
19
190
44
3.32
TOTALS 30,655 109 281 234 0.20
New England Collegiate Baseball League
# Team TOTAL GMS AV 2018 Change
1
Newport Gulls
48,183
20
2,409
2,093
0.15
2
Valley Blue Sox
27,422
20
1,371
1,754
-0.22
3
Martha’s Vineyard Sharks
28,807
22
1,309
1,069
0.22
4
Keene Swamp Bats
27,206
21
1,296
1,491
-0.13
5
Vermont Mountaineers
20,134
22
915
1,252
-0.27
6
Ocean State Waves
14,999
21
714
581
0.23
7
North Adams SteepleCats
11,406
22
518
373
0.39
8
Sanford Mainers
9,969
22
453
567
-0.20
9
Upper Valley Nighthawks
8,577
21
408
490
-0.17
10
Danbury Westerners
6,270
18
348
320
0.09
11
New Bedford Bay Sox
6,152
21
293
367
-0.20
12
Winnipesaukee Muskrats
5,846
20
292
222
0.32
13
Mystic Schooners
3,362
22
153
241
-0.37
TOTALS 218,333 272 803 786 0.02
Northwoods League
# Team TOTAL GMS AV 2018 Change
1
Madison Mallards
218,866
36
6,080
6,249
-0.03
2
La Crosse Loggers
91,111
35
2,603
2,740
-0.05
3
Kalamazoo Growlers
82,246
32
2,570
2,139
0.20
4
Kenosha Kingfish
83,176
33
2,520
2,560
-0.02
5
Bismarck Larks
66,111
35
1,889
1,890
0.00
6
Traverse City Pit Spitters
60,253
36
1,674
NA
NA
7
Green Bay Booyah
60,023
36
1,667
1,230
0.36
8
St. Cloud Rox
57,141
35
1,633
1,562
0.05
9
Wisconsin Woodchucks
51,796
36
1,439
1,433
0.00
10
Wisconsin Rapids Rafters
44,679
33
1,354
1,336
0.01
11
Mankato MoonDogs
48,340
36
1,343
1,303
0.03
12
Eau Claire Express
45,917
35
1,312
1,393
-0.06
13
Lakeshore Chinooks
45,870
36
1,274
1,354
-0.06
14
Rochester Honkers
37,627
33
1,140
887
0.29
15
Kokomo Jackrabbits
37,299
36
1,036
1,395
-0.26
16
Rockford Rivets
34,699
34
1,021
894
0.14
17
Willmar Stingers
35,218
35
1,006
1,001
0.00
18
Fond du Lac Dock Spiders
33,142
34
975
906
0.08
19
Waterloo Bucks
35,004
36
972
993
-0.02
20
Duluth Huskies
33,989
36
944
1,349
-0.30
21
Battle Creek Bombers
29,818
35
852
898
-0.05
22
Thunder Bay Border Cats
30,139
36
837
823
0.02
TOTALS 1,262,464 769 1,642 1,642 0.00
Prospect League
# Team TOTAL GMS AV 2018 Change
1
Chillicothe Paints
57,040
28
2,037
1,884
0.08
2
Danville Dans
40,459
26
1,556
1,725
-0.10
3
Springfield Sliders
27,840
27
1,031
1,283
-0.20
4
Quincy Gems
24,803
27
919
876
0.05
5
Lafayette Aviators
24,088
27
892
616
0.45
6
Terre Haute Rex
21,512
27
797
877
-0.09
7
West Virginia Miners
21,970
28
785
1,035
-0.24
8
Normal CornBelters
20,448
29
705
NA
NA
9
Cape Catfish
17,092
27
633
NA
NA
10
Champion City Kings
11,495
28
411
369
0.11
11
Hannibal Hoots
3,563
23
155
556
-0.72
12
DuPage Pistol Shrimp
2,837
22
129
NA
NA
TOTALS 273,147 319 856 1,025 -0.16
Western Canadian Baseball League
# Team TOTAL GMS AV 2018 Change
1
Okotoks Dawgs
102,368
26
3,937
3,676
0.07
2
Edmonton Prospects
54,655
26
2,102
2,053
0.02
3
Medicine Hat Mavericks
22,225
28
794
900
-0.12
4
Lethbridge Bulls
17,371
26
668
1,022
-0.35
5
Fort McMurray Giants
15,409
26
593
578
0.03
6
Regina Red Sox
15,892
27
589
732
-0.20
7
Moose Jaw Miller Express
8,878
25
355
351
0.01
8
Swift Current 57s
8,963
28
320
390
-0.18
9
Weyburn Beavers
8,574
27
318
299
0.06
10
Brooks Bombers
4,874
26
191
181
0.06
11
Yorkton Cardinals
3,733
26
144
184
-0.22
12
Melville Millionaires
3,082
25
123
124
-0.01
TOTALS 266,024 316 843 856 -0.02
West Coast League
# Team TOTAL GMS AV 2018A +/-
1
Victoria HarbourCats
62,400
27
2,311
2,318
0.00
2
Portland Pickles
60,803
27
2,252
2,016
0.12
3
Corvallis Knights
47,358
26
1,821
1,274
0.43
4
Bellingham Bells
46,072
26
1,772
1,613
0.10
5
Ridgefield Raptors
32,242
27
1,198
NA
NA
6
Bend Elks
32,150
27
1,191
1,077
0.11
7
Walla Walla Sweets
26,923
27
997
1,255
-0.21
8
Port Angeles Lefties
24,884
25
995
1,380
-0.28
9
Wenatchee AppleSox
24,323
26
936
1,060
-0.12
10
Yakima Valley Pippins
24,064
27
891
1,355
-0.34
11
Kelowna Falcons
22,084
25
883
987
-0.11
12
Cowlitz Black Bears
15,927
27
590
911
-0.35
TOTALS 419,330 317 1,323 1,385 -0.04
About Kevin Reichard
Kevin Reichard is founder and publisher of Ballpark Digest.

