Summer-collegiate baseball has been a changing industry over the last several years, with MLB entering the field after MiLB contraction and a few league failures in 2022 and 2023. Still, overall, the industry appears to be in strong shape, as shown in our 2023 summer collegiate attendance roundups.
Tuesday we posted 2023 summer collegiate attendance numbers in three articles:
2023 summer collegiate attendance by total
2023 summer collegiate attendance by league
2023 summer collegiate attendance by average
Of the three measures, the most telling is the attendance listing by average per game. Total attendance is a function of a heavy schedule (27-36 games) versus a lighter schedule (20 games). By contract, average per game is a pretty good measure of a team’s overall popularity. Of the 10 summer-collegiate leagues where every team reports attendance, numbers were up in eight leagues, with numbers down in two circuits, the MLB Draft League and the Cape Cod League.
Here are some first takes on the 2023 summer collegiate attendance reports:
- Former pro venues make a difference. The Prospect League saw a 27 percent in average attendance per game, led by two former professional-baseball venues entering the circuit’s ballpark ranks. The Jackson Rockabillys performed well in Jackson Baseball Stadium, former home of the Jackson Generals (Class AA; Southern League), while the Thrillville Thrillbillies were a success at Rent One Park, former home of the Southern Illinois Miners (independent; Frontier League). The Edmonton Riverhawks surged to the top of the West Coast League attendance rankings, playing out of RE/MAX Field, former home of Pacific Coast League baseball in the Canadian city.
- Speaking of Canada: the short season for summer-collegiate ball seems perfect for Canada. The Okotoks Dawgs just keep chugging along, drawing 4,558 fans per game, putting the team at #3 in our rankings. Overall, 2023 attendance in the Western Canadian Baseball League rose to 1,111 fans per game, good for a 24 percent boost. The West Coast League, which operates in several Canadian cities, saw a 13 percent boost. Seaman Stadium, home of the Dawgs, won the Ballpark Digest fan vote in the annual Best of the Ballparks competition.
- The MLB Draft League, made up totally of former MiLB venues, saw a 6 percent decline in per-game average. But five of the six teams actually saw growth in 2023. A 42 percent decline in Frederick Keys attendance was big enough to single-handedly depress league numbers. It was an unusual season for the Keys, as team owners added a professional Atlantic League team to the mix as well.
- The Coastal Plain League saw the defection of the Savannah Bananas in 2023, but the league still enjoyed an 8 percent boost in per-game average this summer. The Bananas basically turned pro, hosting games both at home and taking Bananaball to the road, drawing big crowds in pro venues across the country. Founder and head banana Jesse Cole says his goal is to sell out an MLB venue like Fenway Park, and we wouldn’t bet against him.
- Summer collegiate ball is a hard sell in the Dakotas, Wyoming and Nebraska, as seen by the demise of the Expedition League and Independence League in the past two seasons. The Northwoods League headed west to add the Minot Hot Tots to the league in 2023. Several former Independence League teams ended up playing an independent schedule in 2023, with the Western Nebraska Pioneers announcing a move to the Rocky Mountain Baseball League in 2024.
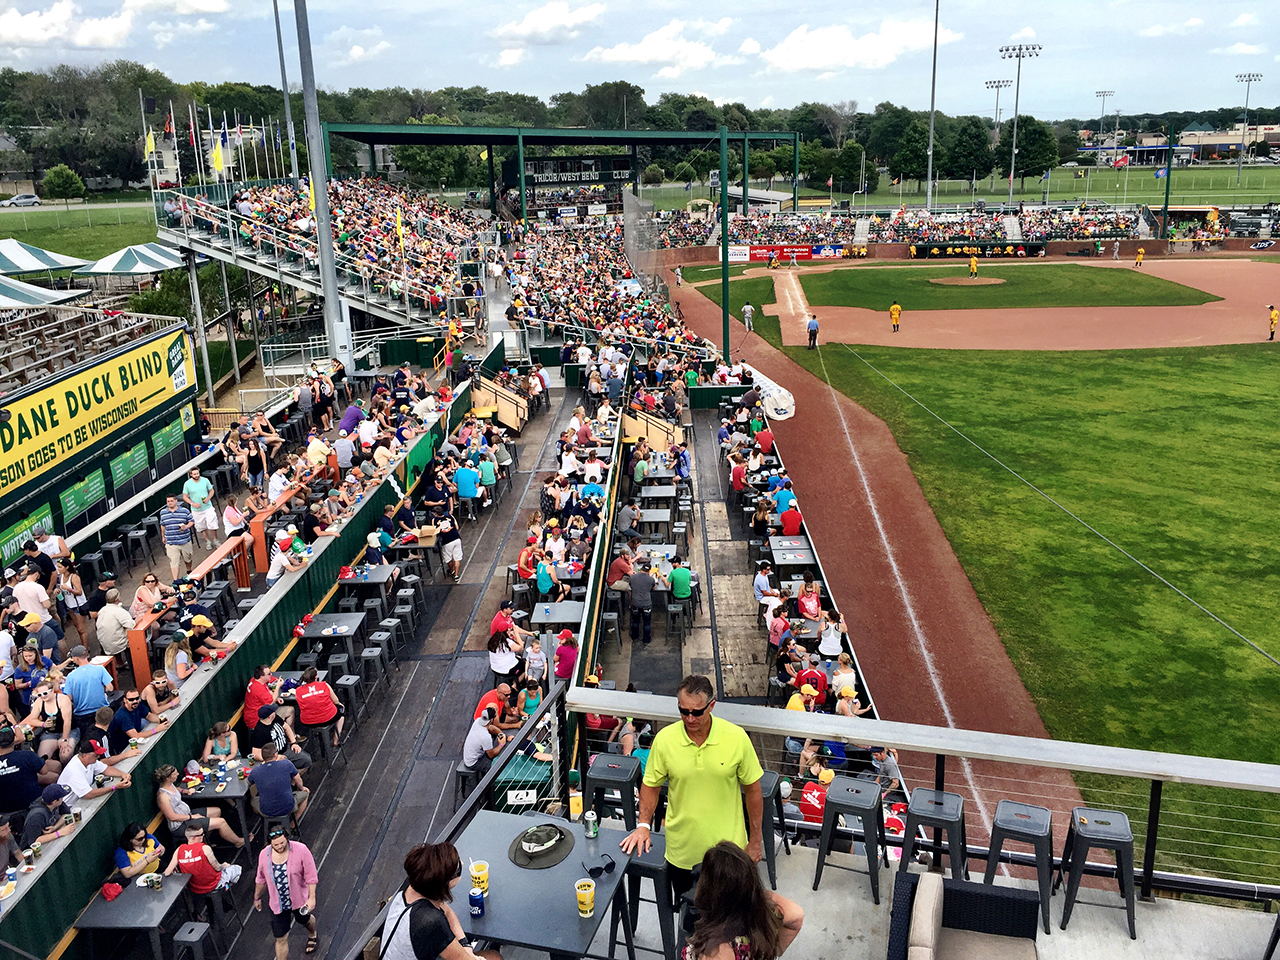
- The Madison Mallards held on to the top spot on per-game average, drawing 6,353 fans to the Duck Pond per match—a level that returns the team to pre-COVID levels. The Trenton Thunder repeated in the #2 slot. The Edmonton Riverhawks (West Coast League) emerged as a top summer-collegiate team, drawing 3,880 fans per game to RE/MAX Field and earning the #4 slot in our rankings.
- Interestingly, the Mallards were the only Northwoods League team in the top ten. In past years, Northwoods League teams dominated this list. It’s not as though the Northwoods League is a laggard—indeed, total attendance per game was up in 2023—it’s just that the rest of the industry is catching up to the circuit that drew up the blueprint for business success on the summer-collegiate level.
- All in all, 16 teams drawing more than 10,000 in a season saw attendance boosts this season of at least 30 percent:
| Team | LGE | TOTAL | GMS | 2023AV | 2022AV | +/-% |
| Lethbridge Bulls | WCBL | 23,462 | 28 | 838 | 332 | 1.52 |
| Bristol State Liners | AppL | 25,674 | 19 | 1,351 | 541 | 1.50 |
| Martha’s Vineyard Sharks | NECBL | 61,607 | 22 | 2,800 | 1,579 | 0.77 |
| Johnson City Doughboys | AppL | 87,719 | 24 | 3,655 | 2,106 | 0.74 |
| Edmonton Riverhawks | WCL | 104,748 | 27 | 3,880 | 2,342 | 0.66 |
| Normal CornBelters | ProL | 24,584 | 23 | 1,069 | 671 | 0.59 |
| Greeneville Flyboys | AppL | 45,251 | 20 | 2,263 | 1,559 | 0.45 |
| Regina Red Sox | WCBL | 23,688 | 27 | 877 | 662 | 0.32 |
| Springfield Lucky Horseshoes | ProL | 49,681 | 29 | 1,713 | 1,301 | 0.32 |
| HP-Thomasville HiToms | CPL | 23,315 | 26 | 897 | 691 | 0.30 |
| Martinsville Mustangs | CPL | 19,222 | 19 | 1,012 | 781 | 0.30 |
| Danville Otterbots | AppL | 35,339 | 23 | 1,536 | 1,202 | 0.28 |
| Victoria HarbourCats | WCL | 65,798 | 27 | 2,437 | 1,919 | 0.27 |
| Worcester Bravehearts | FCBL | 53,605 | 27 | 1,985 | 1,570 | 0.26 |
| O’Fallon Hoots | ProL | 28,370 | 24 | 1,182 | 938 | 0.26 |
| Batavia Muckdogs | PGL | 45,178 | 20 | 2,259 | 1,798 | 0.26 |
| Rockford Rivets | NorthWL | 38,386 | 35 | 1,097 | 874 | 0.26 |
| Sylvan Lake Gulls | WCBL | 45,105 | 28 | 1,611 | 1,291 | 0.25 |
Next up: our attendance ranking for the MLB Partner Leagues after the regular season ends for the Atlantic League.
The story first appeared in the free Ballpark Digest newsletter. Are you a subscriber? Sign up here.
RELATED STORIES: 2023 summer collegiate attendance by average; 2023 summer collegiate attendance by league; 2023 summer collegiate attendance by total