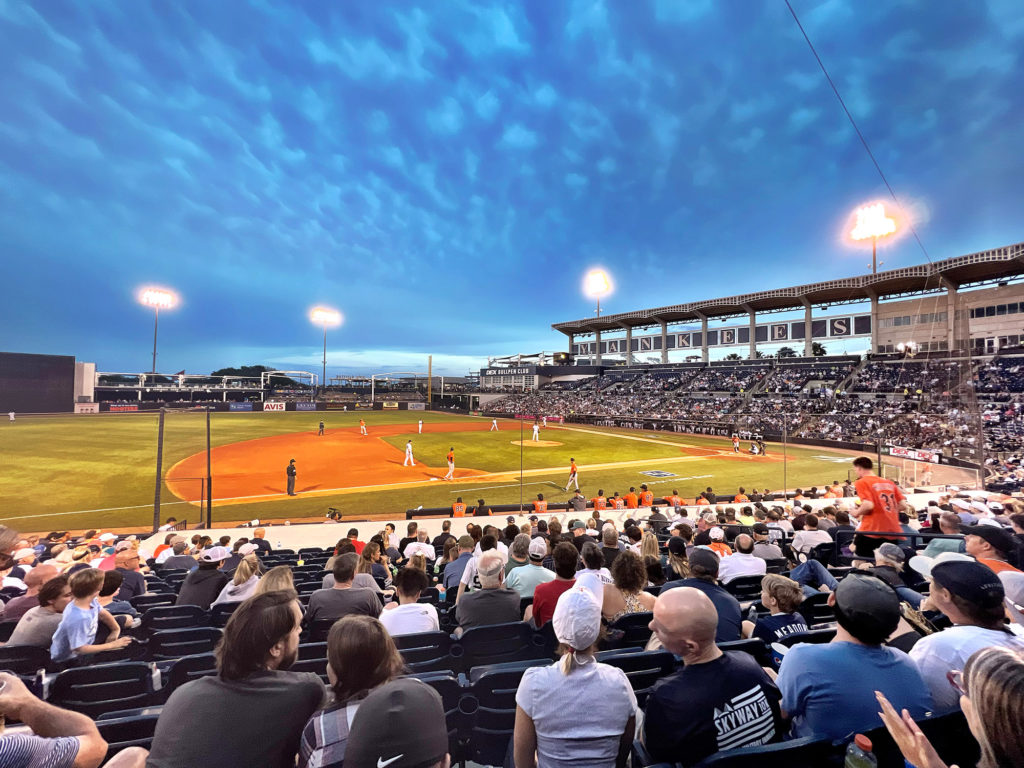
We have our first attendance figures of the 2022 baseball season, as we present the 2022 spring training attendance numbers, ranked by per-game average.
What do these numbers mean? Well, to be totally honest, not a lot. We have not seen a normal spring training since 2019: 2020 was shut down due to COVID-19, 2021 was played under limited capacities, and 2022 was scaled back due to the MLB player lockout.
Which makes a comparison to previous spring trainings so difficult. Because 2021 was so outside the bounds of a conventional spring training, we’ve decided to compare 2022 numbers to 2020 numbers. But even then there are some extenuating circumstances when crunching the numbers.
The biggest comes when we look at the top teams in spring training attendance: the Dodgers and Angels. These numbers are a little skewed by how MLB calculates numbers vs. how the Cactus League and Grapefruit League tally numbers. (Our rankings are based on MLB reports.) MLB includes exhibition games, including the annual Angels/Dodgers and A’s/Giants games, in its rankings; the state-based leagues don’t count those games. That’s why, the past, the Dodgers, Angels, Giants and A’s could report per-game averages far exceeding their spring ballpark capacities. And we saw that the spring; with three games in Los Angeles, both the Dodgers and Angels reported some respectable numbers. Those California exhibitions were canceled in 2020.
The other extenuating circumstance when looking at this year’s numbers is huge: the player lockout forced a rescheduling of games while also scaling back the number of games. Given how many fans canceled their spring-training games, it’s a wonder attendance was down only 8 percent when compared to 2020. (Then again, the per-game numbers were down some 31 percent from 2019, the last normal spring training before COVID-19 and lockout.) The rescheduling imposed regional play as well, forcing the eastern teams to play fewer games. Technically, the Houston Astros played only six spring-training home games and did not schedule two Minute Maid Park exhibitions to close spring training.
Here are the 2022 spring training numbers as reported by MLB:
| Team | Total | Gms | Av. | 2020A | +/- | |
| 1 | Los Angeles Dodgers | 121,340 | 10 | 12,134 | 7,996 | 0.52 |
| 2 | Los Angeles Angels | 83,919 | 8 | 10,490 | 5,037 | 1.08 |
| 3 | Chicago Cubs | 99,219 | 10 | 9,920 | 10,417 | -0.05 |
| 4 | Boston Red Sox | 73,303 | 10 | 7,330 | 8,715 | -0.16 |
| 5 | New York Yankees | 67,559 | 10 | 6,756 | 7,950 | -0.15 |
| 6 | San Francisco Giants | 60,181 | 9 | 6,687 | 7,062 | -0.05 |
| 7 | Arizona Diamondbacks | 75,831 | 12 | 6,319 | 9,386 | -0.33 |
| 8 | Colorado Rockies | 57,752 | 11 | 5,250 | 7,567 | -0.31 |
| 9 | New York Mets | 41,939 | 8 | 5,242 | 5,178 | 0.01 |
| 10 | Seattle Mariners | 46,341 | 9 | 5,149 | 5,597 | -0.08 |
| 11 | Atlanta Braves | 46,320 | 9 | 5,147 | 5,393 | -0.05 |
| 12 | Kansas City Royals | 41,085 | 8 | 5,136 | 4,368 | 0.18 |
| 13 | Philadelphia Phillies | 45,749 | 9 | 5,083 | 4,168 | 0.22 |
| 14 | Minnesota Twins | 45,505 | 9 | 5,006 | 7,778 | -0.36 |
| 15 | Detroit Tigers | 42,158 | 9 | 4,684 | 6,581 | -0.29 |
| 16 | Baltimore Orioles | 38,351 | 9 | 4,261 | 4,899 | -0.13 |
| 17 | Oakland Athletics | 42,465 | 10 | 4,247 | 5,126 | -0.17 |
| 18 | Milwaukee Brewers | 37,813 | 9 | 4,201 | 5,871 | -0.28 |
| 19 | San Diego Padres | 32,618 | 8 | 4,077 | 4,467 | -0.09 |
| 20 | Chicago White Sox | 36,349 | 9 | 4,039 | 3,076 | 0.31 |
| 21 | St. Louis Cardinals | 28,017 | 7 | 4,002 | 5,122 | -0.22 |
| 22 | Texas Rangers | 35,467 | 9 | 3,941 | 4,232 | -0.07 |
| 23 | Toronto Blue Jays | 30,490 | 8 | 3,811 | 5,207 | -0.27 |
| 24 | Pittsburgh Pirates | 30,738 | 9 | 3,415 | 6,326 | -0.46 |
| 25 | Cincinnati Reds | 29,600 | 9 | 3,289 | 3,091 | 0.06 |
| 26 | Cleveland Guardians | 28,662 | 9 | 3,185 | 4,905 | -0.35 |
| 27 | Miami Marlins | 20,020 | 7 | 2,860 | 3,466 | -0.17 |
| 28 | Tampa Bay Rays | 28,306 | 10 | 2,831 | 3,709 | -0.24 |
| 29 | Washington Nationals | 20,164 | 8 | 2,521 | 3,971 | -0.37 |
| 30 | Houston Astros | 14,155 | 6 | 2,359 | 3,840 | -0.39 |
| 1,400,966 | 268 | 5,227 | 5,688 | -0.08 |
It’s hard not to come to a major conclusion: the 2022 numbers didn’t tell us much, past that fans were inconvenienced first by COVID and then by the MLB lockout.
